Introduction
Gene Set Association Analysis for RNA-Seq with Sample Permutation (GSAASeqSP) is a toolset for gene set association analysis of RNA-Seq count data. GSAASeqSP identify pathways/gene sets significantly associated with a disease or a phenotype by analyzing genome-wide patterns of gene expression variation measured by RNA-Seq technology.
The software GSAASeqSP is a Java based desktop application which implements methods described in
Qing Xiong, Sayan Mukherjee, Terrence S. Furey. GSAASeqSP: A toolset for gene set association analysis of RNA-Seq data. Scientific Reports. 2014 Sep; 4:6347
Downloading software
Software GSAASeqSP is released as a functionally independent module in our GSAA platform that is available for free download at http://gsaa.unc.edu
GSAASeqSP can run on any computer (Windows, Mac OS X, Linux etc.) that supports Java7+. Java7+ is available at http://java.sun.com/javase/downloads/index.jsp
Getting Started
Starting GSAASeqSP Desktop Application
Unzip or untar the downloaded program file into a directory. Remember, lib and GSAA.jar must be in the same directory.
Windows user:
To launch GSAA, double click the icon of GSAA.jar file or use command
Java –Xmx1000m –jar full-path/GSAA.jar
Linux and Mac user:
Java –Xmx1000m –jar full-path/GSAA.jar
Parameter –Xmx specifies the amount of memory available to Java. If you get error message “out of memory”, try to increase 1000m to 2000m or more. GSAASeqSP has been successfully used with 20000m on a Linux server.
full_path is the complete path of the GSAA.jar file
Example: Java –Xmx1000m –jar C:/programs/gsaa/GSAA.jar
When GSAA starts, the main window appears. The main components of the user interface are as follows:
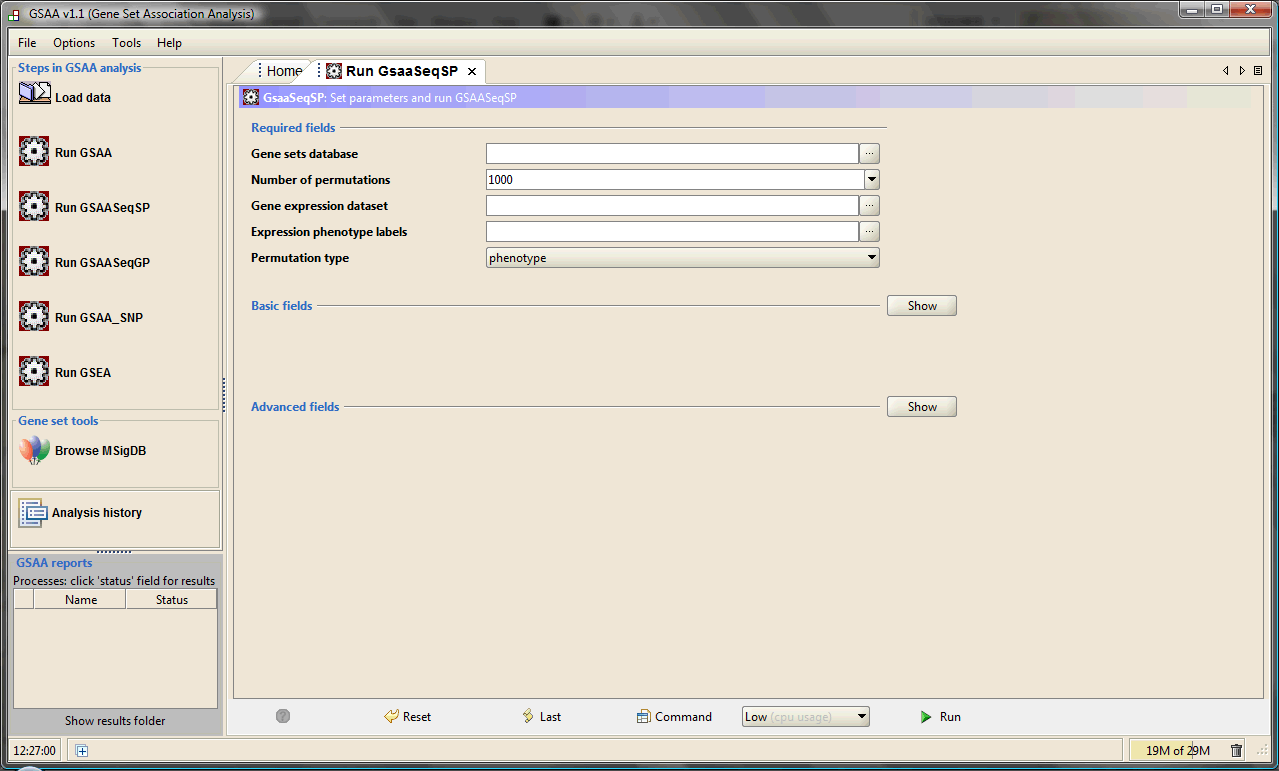
1. The navigation bar on the left, which provides quick access to common GSAA operations.
2. The Processes panel in the bottom left corner, which provides information about the status of your analyses.
3. The main panel on the right, which is used to display dialogs and results. When you start GSAA, the main panel displays the Home page. To open GSAASeqSP page, click the icon "Run GSAASeqSP", GSAASeqSP tab will appear next to the Home tab. To close the page, click the close (X) icon on the tab.
Exiting GSAASeqSP
To exit from GSAASeqSP:
1. Click the close (x) button on the top-right corner of the GSAASeqSP window.
2. Select File>Exit.
Getting Help
The GSAA web site is your primary source of help for GSAASeqSP. It includes the following resources:
1. Documentation. The GSAASeqSP documentation includes this User Guide.
2. Publications. The web site provides a link to the paper describing the algorithms.
If you cannot find the answers to your questions on our web site, contact us at qxiong@email.unc.edu.
Preparing Data Files for GSAASeqSP
When you use GSAASeqSP, you supply three data files: an expression dataset file, a phenotype labels file, a gene sets file. The following table lists each type of data file and its valid file formats. All files are tab-delimited ASCII text files; they can be created and edited using any text editor.
| Data File | Content | Format | Source |
|---|---|---|---|
| Expression dataset | Contains gene names, samples, and a count for each gene in each sample. The count values must be raw counts of sequencing reads. Expression data can come from any source. | gct | You create the file. |
| Phenotype labels | Contains phenotype labels and associates each sample with a phenotype. Only categorical labels are allowed in GSAASeqSP. | cls | You create the file. |
| Gene sets | Contains one or more gene sets. For each gene set, gives the gene set name and list of features (genes or probes) in that gene set. | gmx or gmt | You use the files on the Broad ftp site, export gene sets from the Molecular Signature Database (MSigDb) or create your own gene sets file. |
You can create and edit GSAASeqSP files using Excel or any text editor. If you use Excel to create a tab-delimited text file: select File>Save As, enter the file name in quotes to preserve the the file extension (for example, "lung.gct"), and select "Text(Tab delimited)(*.txt)" as the file type. Excel displays a message warning you that your file may contain features that are not compatible with this format and asks if you want to keep the workbook in this format. Click Yes to keep this format. Your file has now been saved. Exit from Excel. When Excel asks if you want to save your changes to this file, select No (you have already saved the file).
In addition, do not use hypens (-) in the file names.
For descriptions and examples of GSEA-related file formats gct, gmx, gmt, see GSEA User Guide and GSEA file formats. For GSAASeqSP file formats, see below
RNA-Seq Data Format (*.gct)
The GCT format is a tab delimited file format that describes a RNA-Seq dataset. It is organized as follows:

The first line contains comments describing the dataset. The first line must start with #.
Line format: # anything
Example: # kidney liver rnaseq dataset
The second line contains the number of genes and the number of samples.
Line format: (number of genes) (tab) (number of samples)
Example: 15584 14
The remainder of the data file contains count data for each of the genes. There is one row for each gene and one column for each of the samples. The number of rows and columns should agree with the number of rows and columns specified on line 2. Each row contains a gene name, a description (a na means no description), a count value for each sample.
Line format: (gene name) (tab) (description) (tab) (col 1 data) (tab) (col 2 data) (tab) ... (col N data)
Example: GDA na 87 52 79 90 60 93
Phenotype Data Format (*.cls)
The CLS file format defines categorical phenotype (class or template) labels and associates each sample in the expression data with a label. Only two phenotypic classes, for example, tumor vs normal, are allowed. We recommend that you use the class of interest, for example tumor, as the first class in the CLS file.
The CLS file format uses spaces or tabs to separate the fields. It is organized as follows:
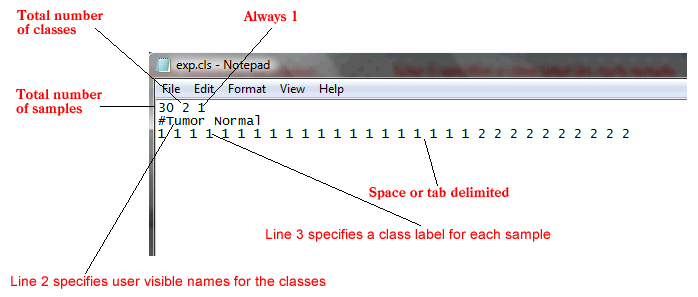
The first line of a CLS file contains numbers indicating the number of samples and number of classes (2). The number of samples should correspond to the number of samples in the associated GCT file.
Line format: (number of samples) (space) 2 (space) 1
Example: 30 2 1
The second line in a CLS file contains a user-visible name for each class. These are the class names that appear in analysis reports. The line should begin with a pound sign (#).
Line format: # (class 1 name) (space) (class 2 name)
Example: #Tumor Normal
The third line contains a class label for each sample. The first label used is assigned to the first class named on the second line; the second unique label is assigned to the second class named. (Note: The order of the labels determines the association of class names and class labels, even if the class labels are the same as the class names.) The number of class labels specified on this line should be the same as the number of samples specified in the first line. The number of unique class labels specified on this line should be the same as the number of classes specified in the first line.
Line format: (sample 1 class) (space) (sample 2 class) (space) ... (sample N class)
Example: 1 1 1 ... 2 2
Loading Data
Click the icon “Load data” to open the Load data page.

There are several ways to load data:
- Clicking the Browse for files button will allow you to select files from your file system and load it into GSAASeqSP. To select multiple files, use SHIFT-click or CTRL-click.
- Clicking the Load last dataset used button will load the data used in the most recent analysis.
- Drag-and-drop the files from a file browser window into the drag-and-drop pane. When the files that you want to load are listed in that pane, click the Load these files button. To remove files from the drag-and-drop pane, click the Clear button.
- The Recently Used Files pane contains files that you have used previously. Double-click a file to load it.
Specifying Parameters
Click the icon “Run GSAASeqSP” to open the GSAASeqSP page. There are three categories of parameters in GSAASeqSP
- Required: Essential parameters which you must specify before the analysis can be run.
- Basic: Additional parameters with standard defaults. Typically, accepting the defaults is ok. Click Show to see these parameters.
- Advanced: Parameters that allow control of several more details of the GSAASeqSP algorithm and the java implementation. Typically, these do not need to be changed by most users. Click Show to see these parameters.
Required Fields

Required fields lists parameters that are essential for the analysis. Enter values for these parameters before starting the analysis.
- Gene sets database. Click the ellipse (…) button and select one or more gene sets:
- GeneMatrix (from website) lists the MSigDB gene sets available on the Broad ftp site. These gene set files may contain hundreds of gene sets. Use the Browse MSigDB Page to browse the gene sets and to create gene set files (gmx/gmt) containing only gene sets of interest.
- GeneSets(grp) lists gene sets that GSAASeqSP has created in memory; for example, gene sets created using the Text Entry tab described below.
- GeneMatrix (local gmx/gmt) lists the gene set files that you have loaded (see Loading Data).
- Subsets lists each gene set in each gmx/gmt file that you have loaded.
- Text Entry allows you to create a gene set by entering the genes for that gene set; enter one gene per line. The gene set is created in memory and deleted when you exit.
- Number of permutations. Specify the number of permutations to perform in assessing the statistical significance of the association score. It is best to start with a small number, such as 10. After the analysis completes successfully, run it again with a full set of permutations.
- Gene Expression dataset. Click the ellipse (…) button to select an expression dataset file from a file browser window.
- Expression phenotype labels. Click the ellipse (…) button to select a phenotype labels file for expression dataset from a file browser window.
- Permutation type. Select the type of permutation to perform in assessing the statistical significance of the association score:
- Phenotype (Sample). Random phenotypes are created by shuffling the phenotype labels on the samples. For each random phenotype, GSAASeqSP ranks the genes and calculates the association score for all gene sets. These association scores are used to create a null distribution from which the significance of the actual association score (for the actual expression data and gene set) is calculated. This is the recommended method when there are at least seven (7) samples in each phenotype.
- Gene_set. Random gene sets, size matched to the actual gene set, are created and their association scores calculated. These association scores are used to create a null distribution from which the significance of the actual association score (for the actual gene set) is calculated. This method is useful when you have too few samples to do phenotype permutations (that is, when you have fewer than seven (7) samples in any phenotype).
We recommends using phenotype/sample permutation whenever possible. The phenotype/sample permutation can preserve the gene-gene correlation structure in the expression data thus it can provide a more biologically reasonable (more stringent) assessment of significance.
Basic Fields
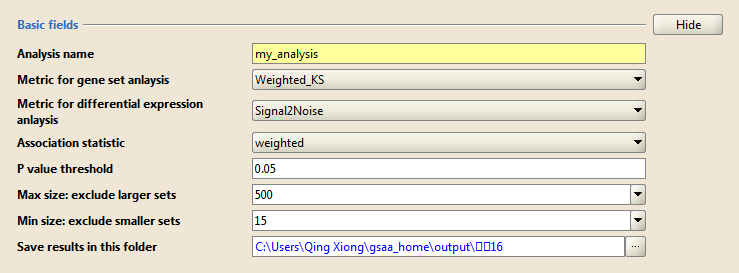
Basic fields lists additional parameters with standard defaults. Typically, you use the default values for these parameters. Click Show/Hide to display and hide these parameters.
- Analysis name. A short descriptive label for the analysis. The name cannot include spaces. This label is used as a prefix when naming the output report generated by the analysis (for example, my_analysis.GsaaSeq.1130510139575.rpt).
- Metric for differential expression analysis. GSAASeqSP ranks genes by their association with phenotype and then analyzes that ranked list of genes. Use this parameter to select the metric used to calculate the differential expression score. Three statistics are provided for differential expression analysis of individual genes in GSAASeqSP: Signal2Noise, log2Ratio, and Signal2Noise_log2Ratio.
Consider two phenotype classes, C1 and C2:- Signal2Noise (default) is the absolute value of the difference of the class means scaled by the standard deviation

where and
and  are the means and standard deviations of expression values of gene i in classes C1 and C2, respectively. The value of the statistic represents the extent to which a gene is differentially expressed between two phenotypic classes; bigger value indicates higher differential expression.
Suppose is the value of the Signal2Noise statistic for the observed data and
  are the values for permutations
  . The p-value for the Signal2Noise statistic is defined as

where is an indicator variable that is one if
  and is otherwise zero. Smaller p-value indicates higher probability that a gene is differentially expressed between two phenotypic classes.
- log2Ratio is the absolute value of the log2 ratio of the class means

where are the means of expression values of gene i in classes C1 and C2, respectively. The value of the statistic represents the extent to which a gene is differentially expressed between two phenotypic classes; bigger value indicates higher differential expression.
Suppose is the value of the log2Ratio statistic for the observed data and
  are the values for permutations
  . The p-value for the log2Ratio statistic is defined as

where is an indicator variable that is one if
  and is otherwise zero. Smaller p-value indicates higher probability that a gene is differentially expressed between two phenotypic classes.
- Signal2Noise_log2Ratio is the mean of Signal2Noise and log2Ratio

the standard s-scores and r-scores
  are defined by
 and
and 
where and
and  are the means and standard deviations of the null distributions corresponding to
  and
and  , respectively; c is the absolute value of the minimum score of all standard s-scores and standard r-scores of all genes over the observed data and all permutations. The value of the statistic represents the extent to which a gene is differentially expressed between two phenotypic classes; bigger value indicates higher differential expression.
The p-value for the Signal2Noise_log2Ratio statistic is defined as
where is an indicator variable that is one if
  &
&  and is otherwise zero. Smaller p-value indicates higher probability that a gene is differentially expressed between two phenotypic classes.
- Signal2Noise (default) is the absolute value of the difference of the class means scaled by the standard deviation
- Metric for gene set analysis. Use this parameter to select the metric for gene set asssociation analysis. For a particular gene set S including H genes, given the differential expression scores
 and the corresponding p-values
  for all genes in the gene set, a gene set association score (AS) is computed for both the observed data and permutations based on any of the seven set-level statistics: Weighted_KS, L2Norm, Mean, WeightedSigRatio, SigRatio, GeometricMean, FisherMethod.
- Weighted Kolmogorov-Smirnov test (Weighted_KS)
The weighted K-S test determines for each gene set whether the genes belonging to that gene set are preferentially near the top of the ranked ordered list based on differential expression scores. Given the rank ordered differential expression scores for all genes in the data set, a running association score
  for the rank ordered genes in positions i=1, ..., N is computed as

Where is an indicator variable that is one if the jth gene in the rank ordered list is in gene set S and otherwise zero. Similarly,
  takes the value of zero if the jth gene is in the gene set and is otherwise one. The association score of gene set S, AS(S), is the maximum deviation from zero of the running association score over the positions i=1, ..., N

Finally, if |AS(S)+|>|AS(S)-| then the final gene set association score AS(S)=AS(S)+, otherwise AS(S)=AS(S)-. The absolute magnitude of the AS score indicates the strength of the association between the gene set and the phenotype, and the sign indicates which phenotypic class the gene set is associated with. - L2-norm (L2Norm)
The association score of the gene set S based on the L2-norm is computed as

The AS score indicates the strength of the association between the gene set and the phenotype, and the sign indicates which phenotypic class the gene set is associated with. - Mean (Mean)
The association score of the gene set S based on the mean test is computed as

The AS score indicates the strength of the association between the gene set and the phenotype, and the sign indicates which phenotypic class the gene set is associated with. - Weighted Significance Ratio (WeightedSigRatio)
The association score of the gene set S based on the weighted significance ratio test is computed as
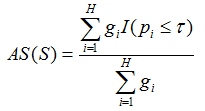
where τ is the p-value threshold that is used as a cutoff for determining significance; is an indicator variable that is one if
  , and is otherwise zero. The AS score indicates the strength of the association between the gene set and the phenotype, and the sign indicates which phenotypic class the gene set is associated with.
 - Significance Ratio (SigRatio)
The association score of the gene set S based on the significance ratio test is computed as

where τ is the p-value threshold that is used as a cutoff for determining significance; is an indicator variable that is one if
  , and is otherwise zero. The AS score indicates the strength of the association between the gene set and the phenotype, and the sign indicates which phenotypic class the gene set is associated with.
 - Geometric mean (GeometricMean)
The association score of the gene set S based on the geometric mean is computed as

The AS score indicates the strength of the association between the gene set and the phenotype, and the sign indicates which phenotypic class the gene set is associated with. - Fisher's method (FisherMethod)
The association score of the gene set S based on the Fisher product test is computed as

The AS score indicates the strength of the association between the gene set and the phenotype, and the sign indicates which phenotypic class the gene set is associated with.
- Weighted Kolmogorov-Smirnov test (Weighted_KS)
- Association statistic. This option controls the value of p used in the Weighted_KS based association score calculation: Larger p gives higher weights to genes with extreme statistic values
- classic: p=0
- weighted (default): p=1
- weighted_p2: p=2
- weighted_p1.5: p=1.5
- P value threshold. Use this parameter to set up the p-value cutoff for WeightedSigRatio, SigRatio, and TruncatedProduct statistics.
- Max size. After filtering from the gene sets any gene not in the expression dataset, gene sets larger than this are excluded from the analysis.
- Min size. After filtering from the gene sets any gene not in the expression dataset, gene sets smaller than this are excluded from the analysis.
- Save results in this folder. Path of the directory in which to place the analysis results. Existing results in this folder are not overwritten. By default, analysis results are saved in the GSAA output folder. To view this folder, select Help>Show GSAA output folder.
Advanced Fields
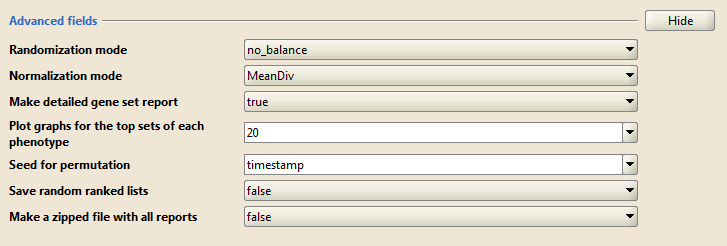
Advanced fields lists parameters that control details of the GSAASeqSP algorithm and its Java implementation. Do not change the default values of these parameters unless you are conversant with the algorithm and its Java implementation. Click Show/Hide to display and hide these parameters.
- Randomization mode. Method used to randomly assign phenotype labels to samples for phenotype permutations. Not used for gene set permutations.
- no_balance (default). Permutes labels without regard to number of samples per phenotype. For example, if your dataset has 12 samples in class_a and 10 samples in class_b, any permutation of class_a has 12 samples randomly chosen from the dataset.
- equalize_and_balance. Permutes labels by equalizing the number of samples per phenotype and then balancing the number of samples contributed by each phenotype. For example, if your dataset has 12 samples in class_a and 10 samples in class_b, any permutation of class_a has 10 samples: 5 randomly chosen from class_a and 5 randomly chosen from class_b.
We recommend using no balance (default), unless the number of samples per phenotype is highly unbalanced.
- Normalization mode. Method used to normalize the association scores (AS) across analyzed gene sets:
- MeanDiv (default): GSAASeqSP normalizes the association scores by dividing a given AS by the mean of its null distribution generated from a permutation procedure.
- Make detailed gene set report. Set to True (default) to create a detailed gene set report for each associated gene set.
- Plot graphs for the top sets of each phenotype. Generates summary plots and detailed analysis results for the top x genes in each phenotype, where x is 20 by default. GSAASeqSP ranks gene sets by their FDR q-values so the top genes are those with the smallest FDR.
- Seed for permutation. Seed used to generate a random number for phenotype and gene set permutations: timestamp (default) or 149. The specific seed value (149) generates consistent results, which is useful when testing software.
- Save random ranked lists (Weighted_KS test only). Set to True (default=false) to save the random ranked lists of genes created by phenotype permutations. When you save random ranked lists, for each permutation, GSAASeqSP saves the rank metric score for each gene (the score used to position the gene in the ranked list). Saving random ranked lists is memory intensive; therefore, this parameter is set to false by default.
- Make a zipped file with all reports. Set to True (default=false) to create a zip file of the analysis results. The zip file is saved to the output folder with all of the other files generated by the analysis. This is useful for sharing analysis results.
Buttons at the bottom of the page:![]()
- Reset. Restores the default values for all parameters.
- Last. Loads the data used the last time you ran this analysis.
- Command. Displays the command line used to run the analysis, as described in Running GSAASeqSP from the Command Line.
- Low/Normal (cpu usage). Determines the amount of CPU dedicated to this analysis. To use your computer for other tasks while running GSAASeqSP in the background, choose Low. To complete your analysis more quickly, choose Normal.
- Run. Starts the analysis.
Running Gene Set Association Analysis
![]()
Click Run to start the analysis
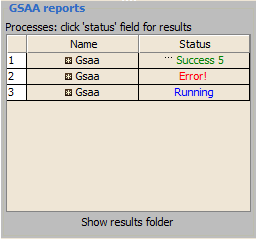
Use the Processes panel at the lower left corner to view the status of analyses run in this session, including the currently running analysis:
1. The blue Running label indicates the currently running analysis. You can click on this label to pause or resume an analysis.
2. If a red Error appears, click on it for a description of the error.
3. When the analysis completes, click the green Success label to display the results in a web browser.
Interpreting GSAASeqSP Results
GSAASeqSP Statistics
Gene Set Association Score (AS)
The primary result of the gene set association analysis is the gene set association score (AS), which reflects the degree to which a gene set is associated with a given phenotype.
In the analysis results of weighted K-S test, the association plot provides a graphical view of the association score for a gene set:
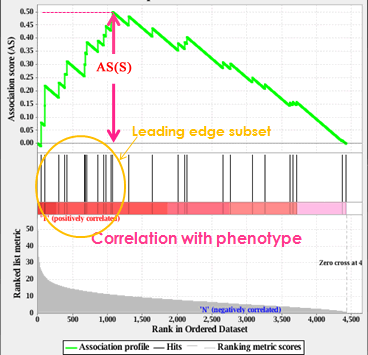
- The top portion of the plot shows the running AS for the gene set as the analysis walks down the ranked list. The score at the peak of the plot (the score furthest from 0.0) is the AS for the gene set. Gene sets with a distinct peak at the beginning (such as the one shown here) or end of the ranked list are generally the most interesting.
- The middle portion of the plot shows where the members of the gene set appear in the ranked list of genes.
The leading edge subset of a gene set is the subset of members that contribute most to the AS. For a positive AS (such as the one shown here), the leading edge subset is the set of members that appear in the ranked list prior to the peak score. For a negative AS, it is the set of members that appear subsequent to the peak score. - The bottom portion of the plot shows the value of the ranking metric as you move down the list of ranked genes. The ranking metric measures a gene’s association with a phenotype. The value of the ranking metric goes from positive to negative as you move down the ranked list.
Normalized Association Score (NAS)
By normalizing the gene set association score, GSAASeqSP accounts for differences in gene set size and in correlations between gene sets and the datasets; therefore, the normalized association scores (NAS) can be used to compare analysis results across gene sets.
Nominal P Value
GSAASeqSP uses a permutation test to evaluate the statistical significance of the AS assigned to a gene set. The statistical significance of the AS is estimated using a nominal P-value that is calculated relative to a null AS distribution generated by permutations.
False Discovery Rate (FDR) and Family-Wise Error Rate (FWER)
GSAASeqSP uses FDR and FWER to correct for multiple hypothesis testing and control the proportion of false positives below a certain threshold.
Given m gene sets ![]() and label permutations
and label permutations ![]() , the FDR of the gene set Si from the Weighted_KS, L2Norm, Mean, WeightedSigRatio, SigRatio, or FisherMethod test is calculated as
, the FDR of the gene set Si from the Weighted_KS, L2Norm, Mean, WeightedSigRatio, SigRatio, or FisherMethod test is calculated as

The FDR for GeometricMean, TruncatedProduct, MinP, or RankSum is calculated as

where ![]() is the normalized association score for gene set j with label permutation π.
is the normalized association score for gene set j with label permutation π. ![]() is the normalized association score for gene set j.
is the normalized association score for gene set j.
The FWER of the gene set Si from the Weighted_KS, L2Norm, Mean, WeightedSigRatio, SigRatio, or FisherMethod test is calculated as
![]()
The FWER for GeometricMean, TruncatedProduct, MinP, or RankSum is calculated as
![]()
GSAASeqSP Report
This section discusses the content of the report generated by the gene set association analysis:
- Association with phenotype
- Gene Set Details
- Gene Markers
- Other
- Detailed Association Results
- Gene Set Details Report
Association with Phenotype

The Association with Phenotype section shows:
- Number of associated gene sets that are significant, as indicated by a false discovery rate (FDR) of less than 25%.
- Number of associated gene sets with a nominal p value of less than 1% and of less than 5%. The nominal p value is not adjusted for gene set size or multiple hypothesis testing; therefore, it is of limited value for comparing gene sets.
- Snapshot of top results. Displays association plots for the gene sets with the smallest FDR. By default, GSAASeqSP displays plots for the top 20 gene sets. To display a different number of plots, use the Plot graphs for the top sets of each phenotype parameter on the Run GSAASeqSP Page. For a description of the association plot, see Association Score (AS).
- Detailed association results provide a summary report of gene sets associated with this phenotype (html and excel formats).
- Guide to interpret results displays this section of the documentation.
Gene Set Details

The Gene Set Details section of the analysis report provides information about the gene sets:
- Number of gene sets filtered out of the analysis due to size, and the minimum and maximum gene set sizes used for the filter.
- Number of gene sets used in the analysis.
- List of analyzed gene sets. For each gene set, the report shows the original number of genes in the gene set, the number of genes in the gene set after filtering out those genes not in the expression dataset, and the status of the gene set. Status is either blank (the gene set was included in the analysis) or “Rejected” (the gene set was filtered out of the analysis).
- The feature identifiers used for the expression dataset do not match those used in the gene sets.
- After filtering out those genes not in the expression dataset, all of the gene sets are either larger than the maximum or smaller than the minimum gene set size allowed. You can use the Max Size and Min Size parameters on the Run GSAASeqSP Page to change the maximum and minimum gene set size.
Gene Markers

The Gene Markers section of the analysis report provides information about the ranked list of genes used for the analysis:
- Number of features (genes) in the expression dataset.
- Rank ordered list of genes in the dataset (Excel format), which includes the following information for each gene: name, description, gene symbol, gene title, and score.
Other

The final section of the report, Other, lists the analysis parameters. Knowing the parameters is critical for reproducing analysis results.
Detailed Association Results
From the Association in Phenotype section of the analysis report, you can click a link to display the detailed association results report, which lists all gene sets ordered by the false discovery rate (FDR):

- GS. Gene set name. Click the gene set name for a detailed description of the gene set. For MSigDB gene sets, the description is the gene set page on the GSEA web site. For other gene sets, the description is provided by the author of the gene set.
- GS DETAILS. For the top 20 gene sets, click the Details link to display the Gene Set Details Report. To generate the Details link for a different number of gene sets, use the Plot graphs for the top sets of each phenotype parameter on the Run GSAASeqSP Page.
- SIZE. Number of genes in the gene set after filtering out those genes not in the expression dataset.
- AS. Association score.
- NAS. Normalized association score.
- NOM p-value. Nominal p value; that is, the statistical significance of the association score. The nominal p value is not adjusted for gene set size or multiple hypothesis testing; therefore, it is of limited use in comparing gene sets.
- FDR q-value. False discovery rate; that is, the estimated probability that the normalized association score represents a false positive finding.
- FWER p-value. Familywise-error rate; that is, a more conservatively estimated probability that the normalized association score represents a false positive finding.
- RANK AT MAX (Weighted_KS test only). The position in the ranked list at which the maximum association score occurred. The more interesting gene sets achieve the maximum association score near the top of the ranked list; that is, the rank at max is very small.
- LEADING EDGE (Weighted_KS test only). Displays the three statistics used to define the leading edge subset:
- Tags. The percentage of gene hits before (for positive AS) or after (for negative AS) the peak in the running association score. This gives an indication of the percentage of genes contributing to the association score.
- List. The percentage of genes in the ranked gene list before (for positive AS) or after (for negative AS) the peak in the running association score. This gives an indication of where in the list the association score is attained.
- Signal. The association signal strength that combines the two previous statistics:

where N is the number of genes in the list and Nh is the number of genes in the gene set. If the gene set is entirely within the first Nh positions in the list, then the signal strength is maximal or 100%. If the gene set is spread throughout the list, then the signal strength decreases towards 0%.
These statistics describe the leading-edge subset of a single gene set. Use the Leading Edge analysis to analyze the overlap between multiple leading-edge subsets.
Gene Set Details Report
From the Detailed Association Results table, click the Details link for a gene set to display a Gene Set Details report that contains the following:
- A table showing the GSAASeqSP results for this gene set. The fields in this table are similar to those in the Detailed Association Results.
- (Weighted_KS test only) An association plot for this gene set, as described in Association Score (AS).
- (Weighted_KS test only) A table of genes in the gene set ordered by their position in the ranked list of genes. The analysis includes only those genes in the gene set that are also in the expression dataset. To display the table in Excel, click the plain text format link in the table header.
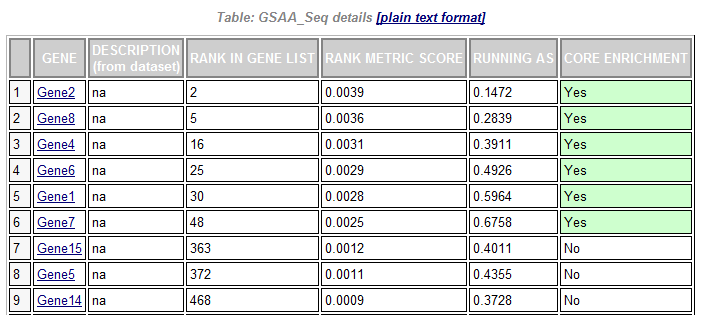
- GENE. Gene name.
- DESCRIPTION(from dataset). Gene description.
- RANK IN GENE LIST. Position of the gene in the ranked list of genes.
- RANK METRIC SCORE. Score used to position the gene in the ranked list.
- RUNNING AS. Running association score; that is, the association score at this point in the ranked list of genes.
- CORE ASSOCIATION . Genes with a Yes value in this column contribute to the leading-edge subset within the gene set. This is the subset of genes that contributes most to the association result. Use the Leading Edge analysis to analyze the overlap between multiple leading-edge subsets.
- A heat map of the genes in the gene set. In a heat map, expression values are represented as colors, where the range of colors (red, pink, light blue, dark blue) shows the range of expression values (high, moderate, low, lowest).
- A histogram of the association scores for all permutations.
Running GSAASeqSP from the Command Line
Syntax
To run GSAASeqSP from the command line, use a java command of the form:
java -cp full-path/GSAA.jar –Xmx5000m gsaa-tool parameters
- -cp Points the CLASSPATH variable to the complete path of the GSAA.jar file. You do not need to set any other CLASSPATH variables.
- -Xmx1000m Specifies the amount of memory available to Java.
- gsaa-tool Specifies the analysis to use. For GSAASeqSP, use xtools.gsea.GsaaSeqSP.
- parameters Specifies the analysis parameters. To find the parameters for an analysis, open the GSAASeqSP application, display the page that runs the analysis, enter the parameters that you want to use, and click the Command button at the bottom of the page. GSAASeqSP displays the command line used to run the analysis. If you omit a parameter, GSAASeqSP uses the default value as displayed in the GSAASeqSP application.
- Paths to file names must be fully specified or relative to the execution directory. When creating batch files, you generally want to use full path names for all files.
- File names are platform-specific and may require editing. For example, on Windows, a file name that contains spaces must be enclosed in quotation marks.
- Files cannot be directly accessed from the GSEA ftp site. Download the desired gene set from the GSEA web site (http://www.broad.mit.edu/gsea/downloads.jsp) and reference the downloaded files in the command line.
- Parameter values cannot include hyphens (-); therefore, file names cannot include hyphens. If necessary, change hyphens to underscores. For example, you cannot use -res my-dataset.gct, but must use -res my_dataset.gct instead.
Parameters
The table below lists the command line options and their corresponding names in the graphical user interface (GUI).
| Command line option | GUI name |
|---|---|
| -gmx | Gene sets database |
| -nperm | Number of permutations |
| -exp_file | Gene expression dataset |
| -exp_template_file | Expression phenotype labels |
| -permute | Permutation type |
| -rpt_label | Analysis name |
| -demetric | Metric for differential expression analysis |
| -gsametric | Metric for gene set association analysis |
| -scoring_scheme | Association statistic |
| -pthreshold | p-value cutoff |
| -set_max | exclude larger sets |
| -set_min | exclude smaller sets |
| -out | save results in this folder |
| -rnd_type | Randomization mode |
| -norm | Normalization mode |
| -make_sets | Make detailed gene set report |
| -plot_top_x | Plot graphs for the top sets of each phenotype |
| -rnd_seed | Seed for permutation |
| -save_rnd_lists | Save random ranked lists |
| -zip_report | Make a zipped file with all reports |
| -gui | graphical user interface |
Examples
1, Following is a command line that assumes that you use the in-house gene set collection in GSAASeqSP, click HERE to see a list of available gene sets databases.
java -cp /home/tcga/program/GSAA.jar -Xmx10000m xtools.gsea.GsaaSeqSP -gmx Genesets:MSigDB.c2.cp.v5.0.symbols.gmt -nperm 2000 -exp_file /home/tcga/data/gbm_tcga_rnaseq.gct -exp_template_file /home/tcga/data/gbm_tcga_rnaseq.cls -gsametric Weighted_KS -demetric Signal2Noise -permute phenotype -rnd_type no_balance -scoring_scheme weighted -norm MeanDiv -rpt_label gsaaseqsp_gbm_tcga_c2.cp.v5.0 -make_sets true -plot_top_x 20 -pthreshold 0.05 -rnd_seed timestamp -save_rnd_lists false -set_max 500 -set_min 15 -zip_report false -out /home/tcga/result/gsaaseqsp -gui false
2, Following is a command line that assumes that you supply the gene sets database file.
java -cp /home/tcga/program/GSAA.jar -Xmx10000m xtools.gsea.GsaaSeqSP -gmx /home/tcga/data/c2.cp.v5.0.symbols.gmt -nperm 2000 -exp_file /home/tcga/data/gbm_tcga_rnaseq.gct -exp_template_file /home/tcga/data/gbm_tcga_rnaseq.cls -gsametric Weighted_KS -demetric Signal2Noise -permute phenotype -rnd_type no_balance -scoring_scheme weighted -norm MeanDiv -rpt_label gsaaseqsp_gbm_tcga_c2.cp.v5.0 -make_sets true -plot_top_x 20 -pthreshold 0.05 -rnd_seed timestamp -save_rnd_lists false -set_max 500 -set_min 15 -zip_report false -out /home/tcga/result/gsaaseqsp -gui false
